Tracking Costs and Usage in Queryloop
Queryloop provides comprehensive cost tracking and usage analytics to help you monitor expenditures, manage budgets, and optimize resource allocation. This guide will walk you through the various tools and features available in the Cost and Usage section of your Queryloop account.
Accessing the Cost and Usage Dashboard
To access the cost tracking and usage analytics:
- Log in to your Queryloop account
- Navigate to the Settings page
- Select the Usage tab from the top navigation menu
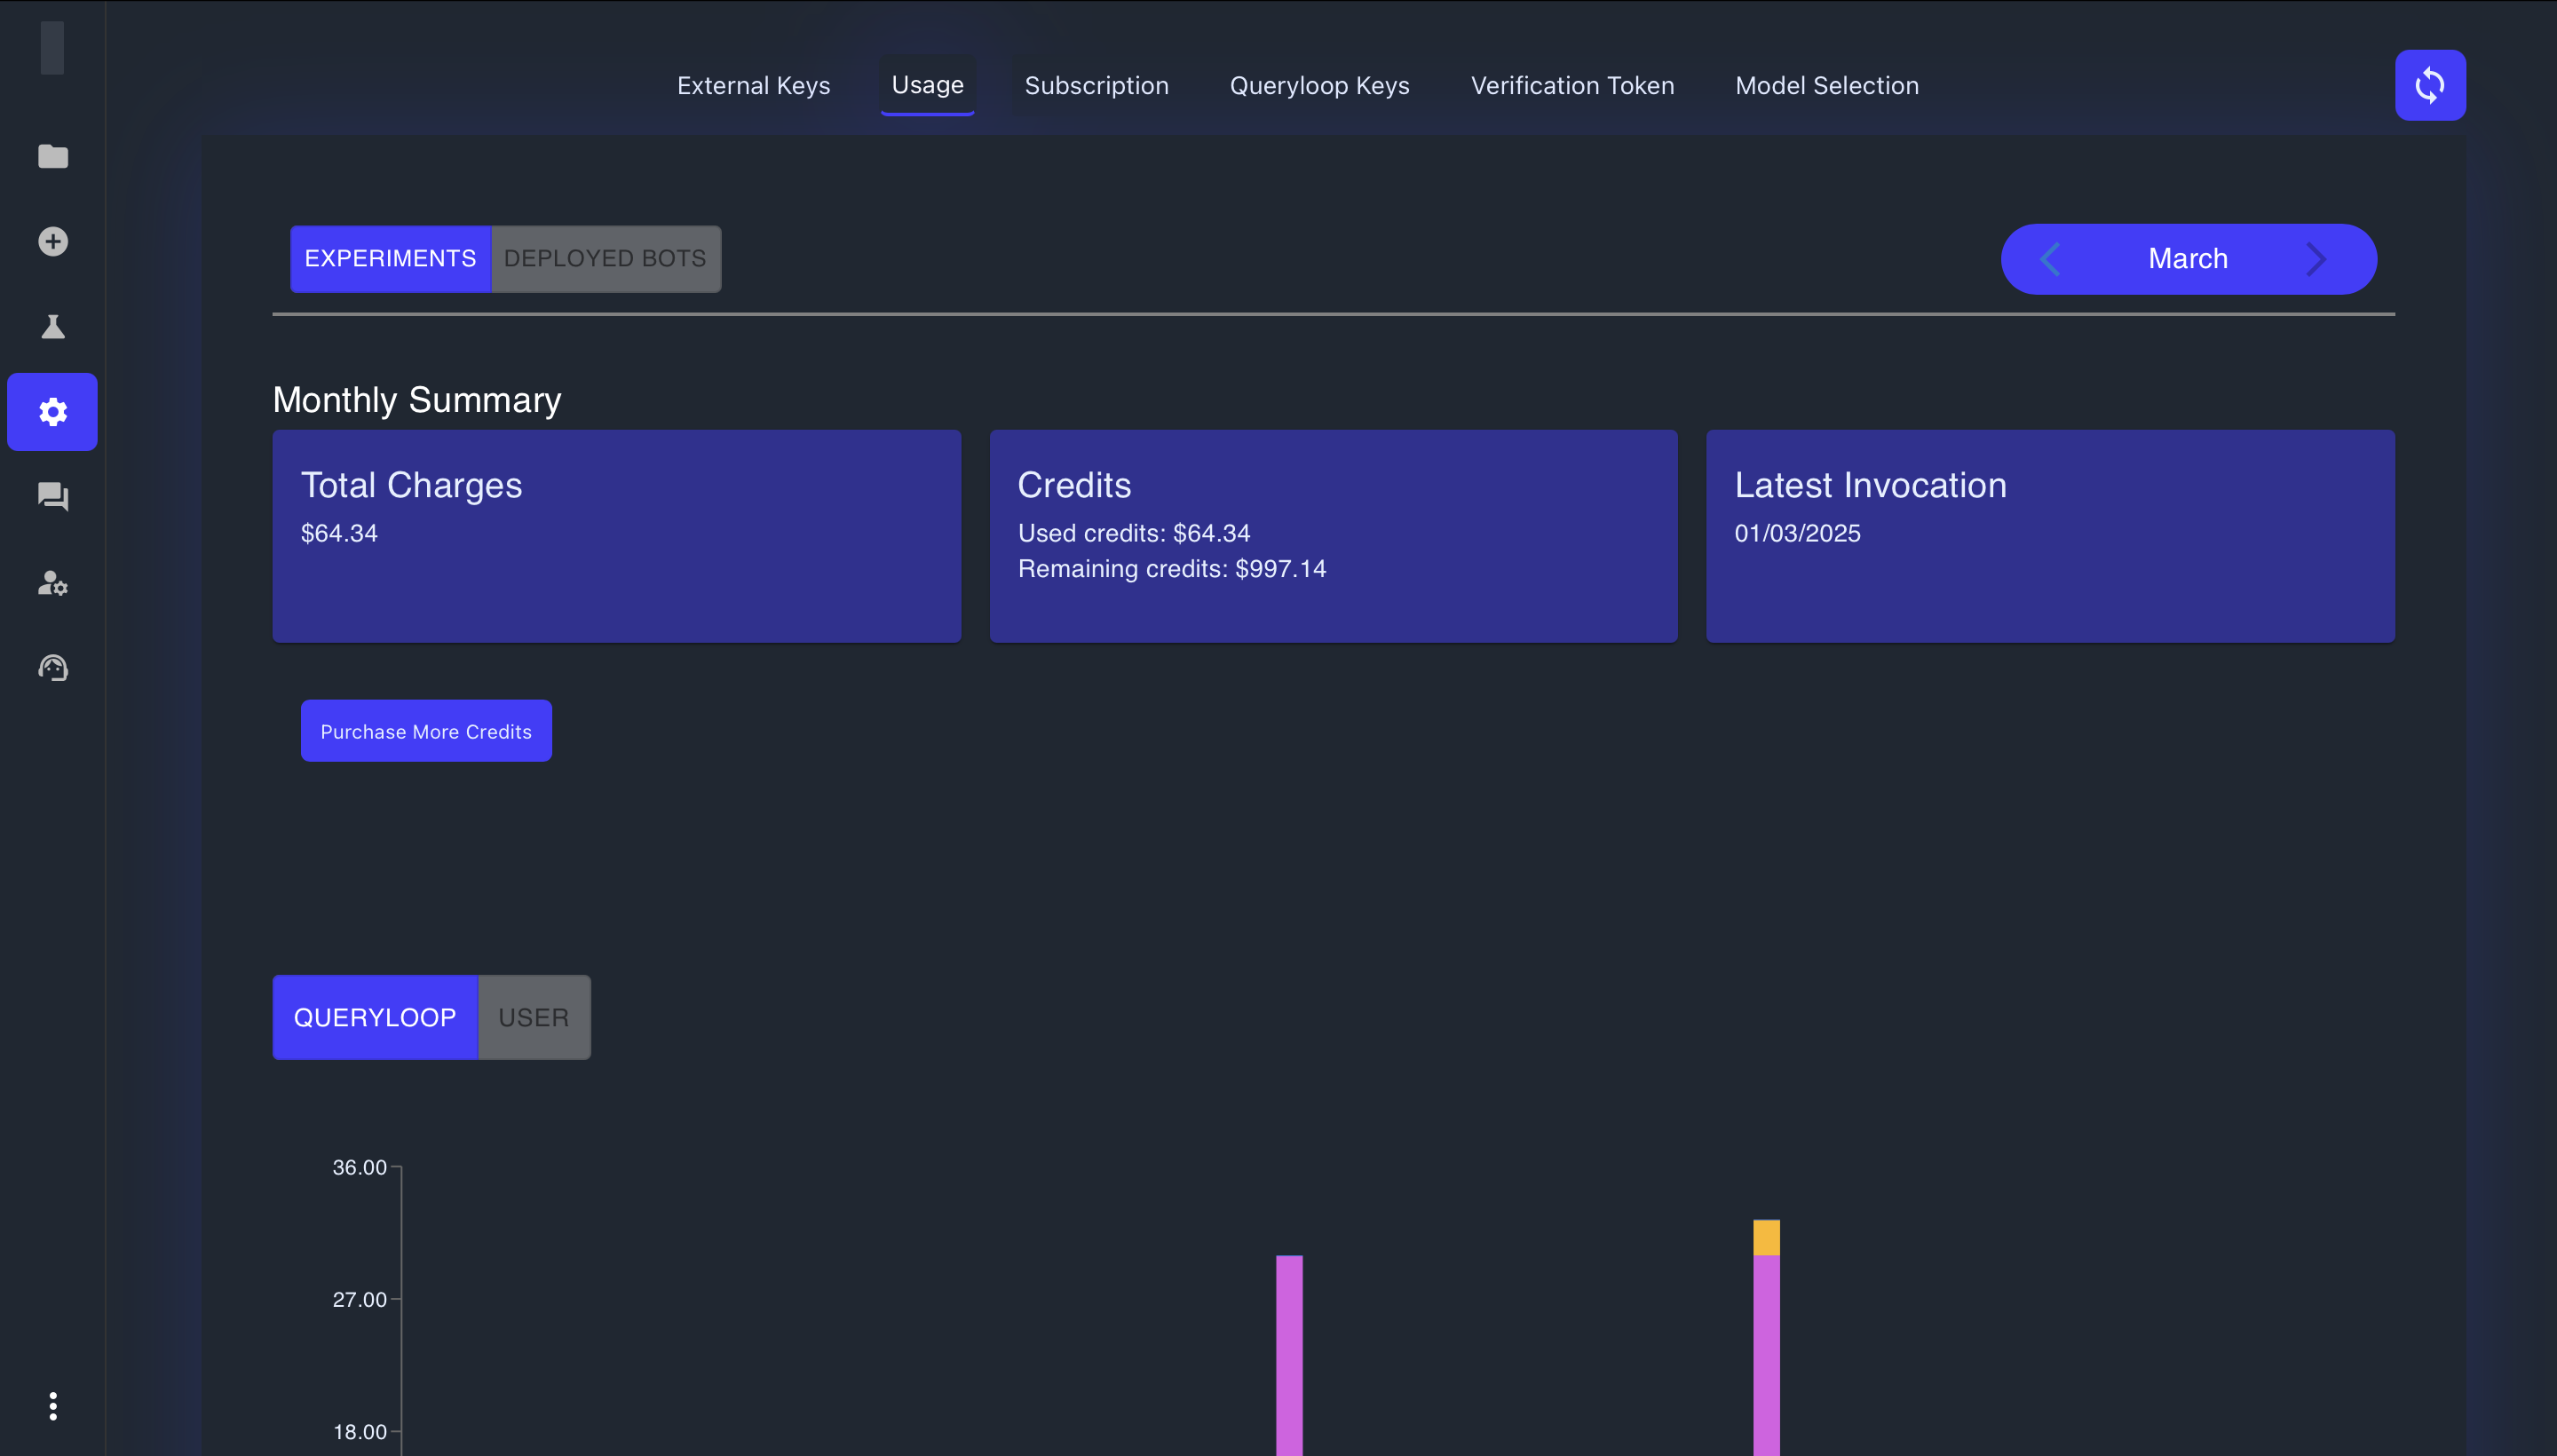
The Usage dashboard provides a complete overview of all costs associated with your Queryloop activities, including experiments, deployed applications, and resource consumption.

Understanding the Monthly Summary
At the top of the Usage dashboard, you'll find a Monthly Summary section that provides a quick overview of your current billing status:
Total Charges
This panel displays the total amount charged for the current month, representing all resources consumed across your Queryloop account.
Credits
The Credits panel shows:
- Used Credits: The amount of credits consumed in the current month
- Remaining Credits: Your current credit balance available for future use
Latest Invocation
Displays the date of the most recent API call or application usage, helping you track activity timing.
Purchasing Additional Credits
If you need to add more credits to your account, the Purchase More Credits button allows you to buy additional credits to continue using Queryloop services without interruption.
Analyzing Costs by Category
The Usage dashboard provides multiple ways to analyze and categorize your expenditures:
Viewing by Account Type
Toggle between QUERYLOOP and USER views to see costs categorized by:
- QUERYLOOP: System-level operations and overhead costs
- USER: Direct costs associated with your specific usage and operations
Experimental vs. Deployed Costs
You can analyze costs by application state by selecting between:
- EXPERIMENTS: Costs associated with testing and optimizing your applications before deployment
- DEPLOYED BOTS: Costs related to live, production applications that are actively serving requests
Cost Breakdown by Application
For a more granular view of your expenses, Queryloop provides detailed cost breakdowns by individual application:
Bot Cost Details
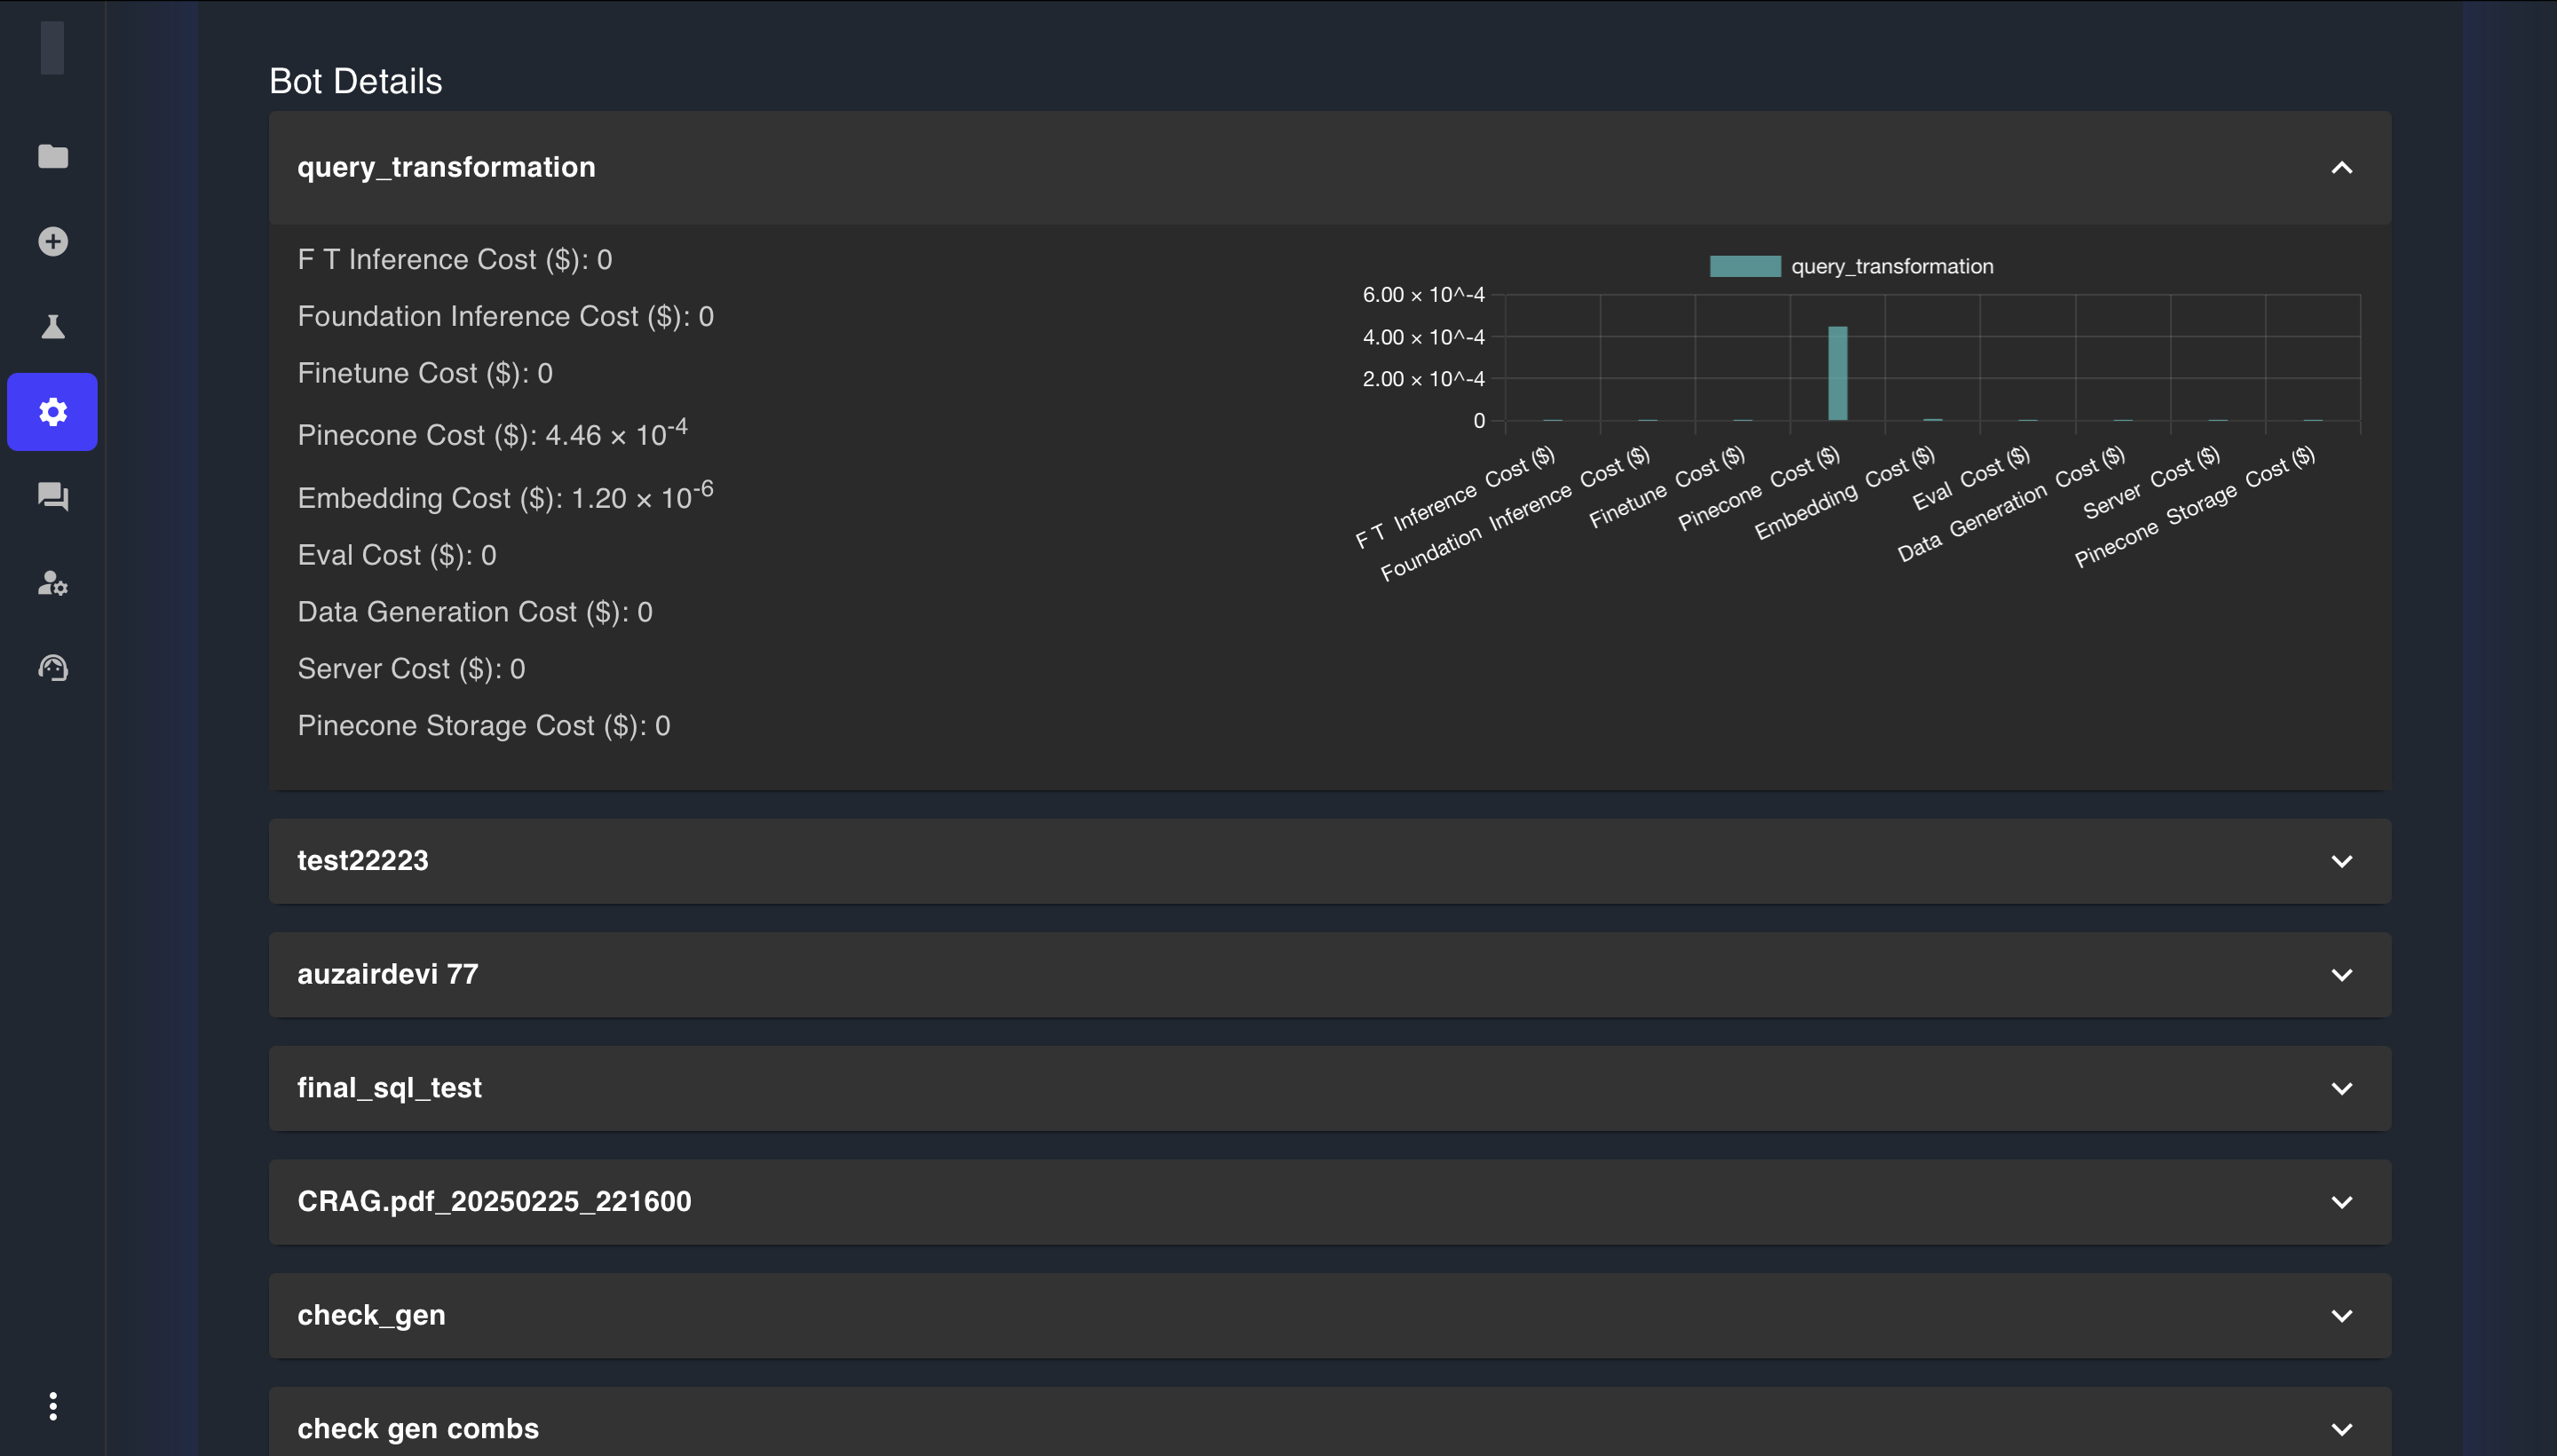
Select any application to view its detailed cost breakdown, including:
- Fine-Tuning (FT) Inference Cost: Expenses related to inference using fine-tuned models
- Foundation Inference Cost: Costs associated with using foundation models for inference
- Finetune Cost: Expenses incurred during model fine-tuning processes
- Pinecone Cost: Costs related to vector database operations
- Embedding Cost: Expenses for generating and storing text embeddings
- Evaluation Cost: Costs associated with model evaluation processes
- Data Generation Cost: Expenses for data processing and generation
- Server Cost: Charges related to computational resources and hosting
- Pinecone Storage Cost: Ongoing storage costs for vector embeddings in Pinecone
Cost Table View
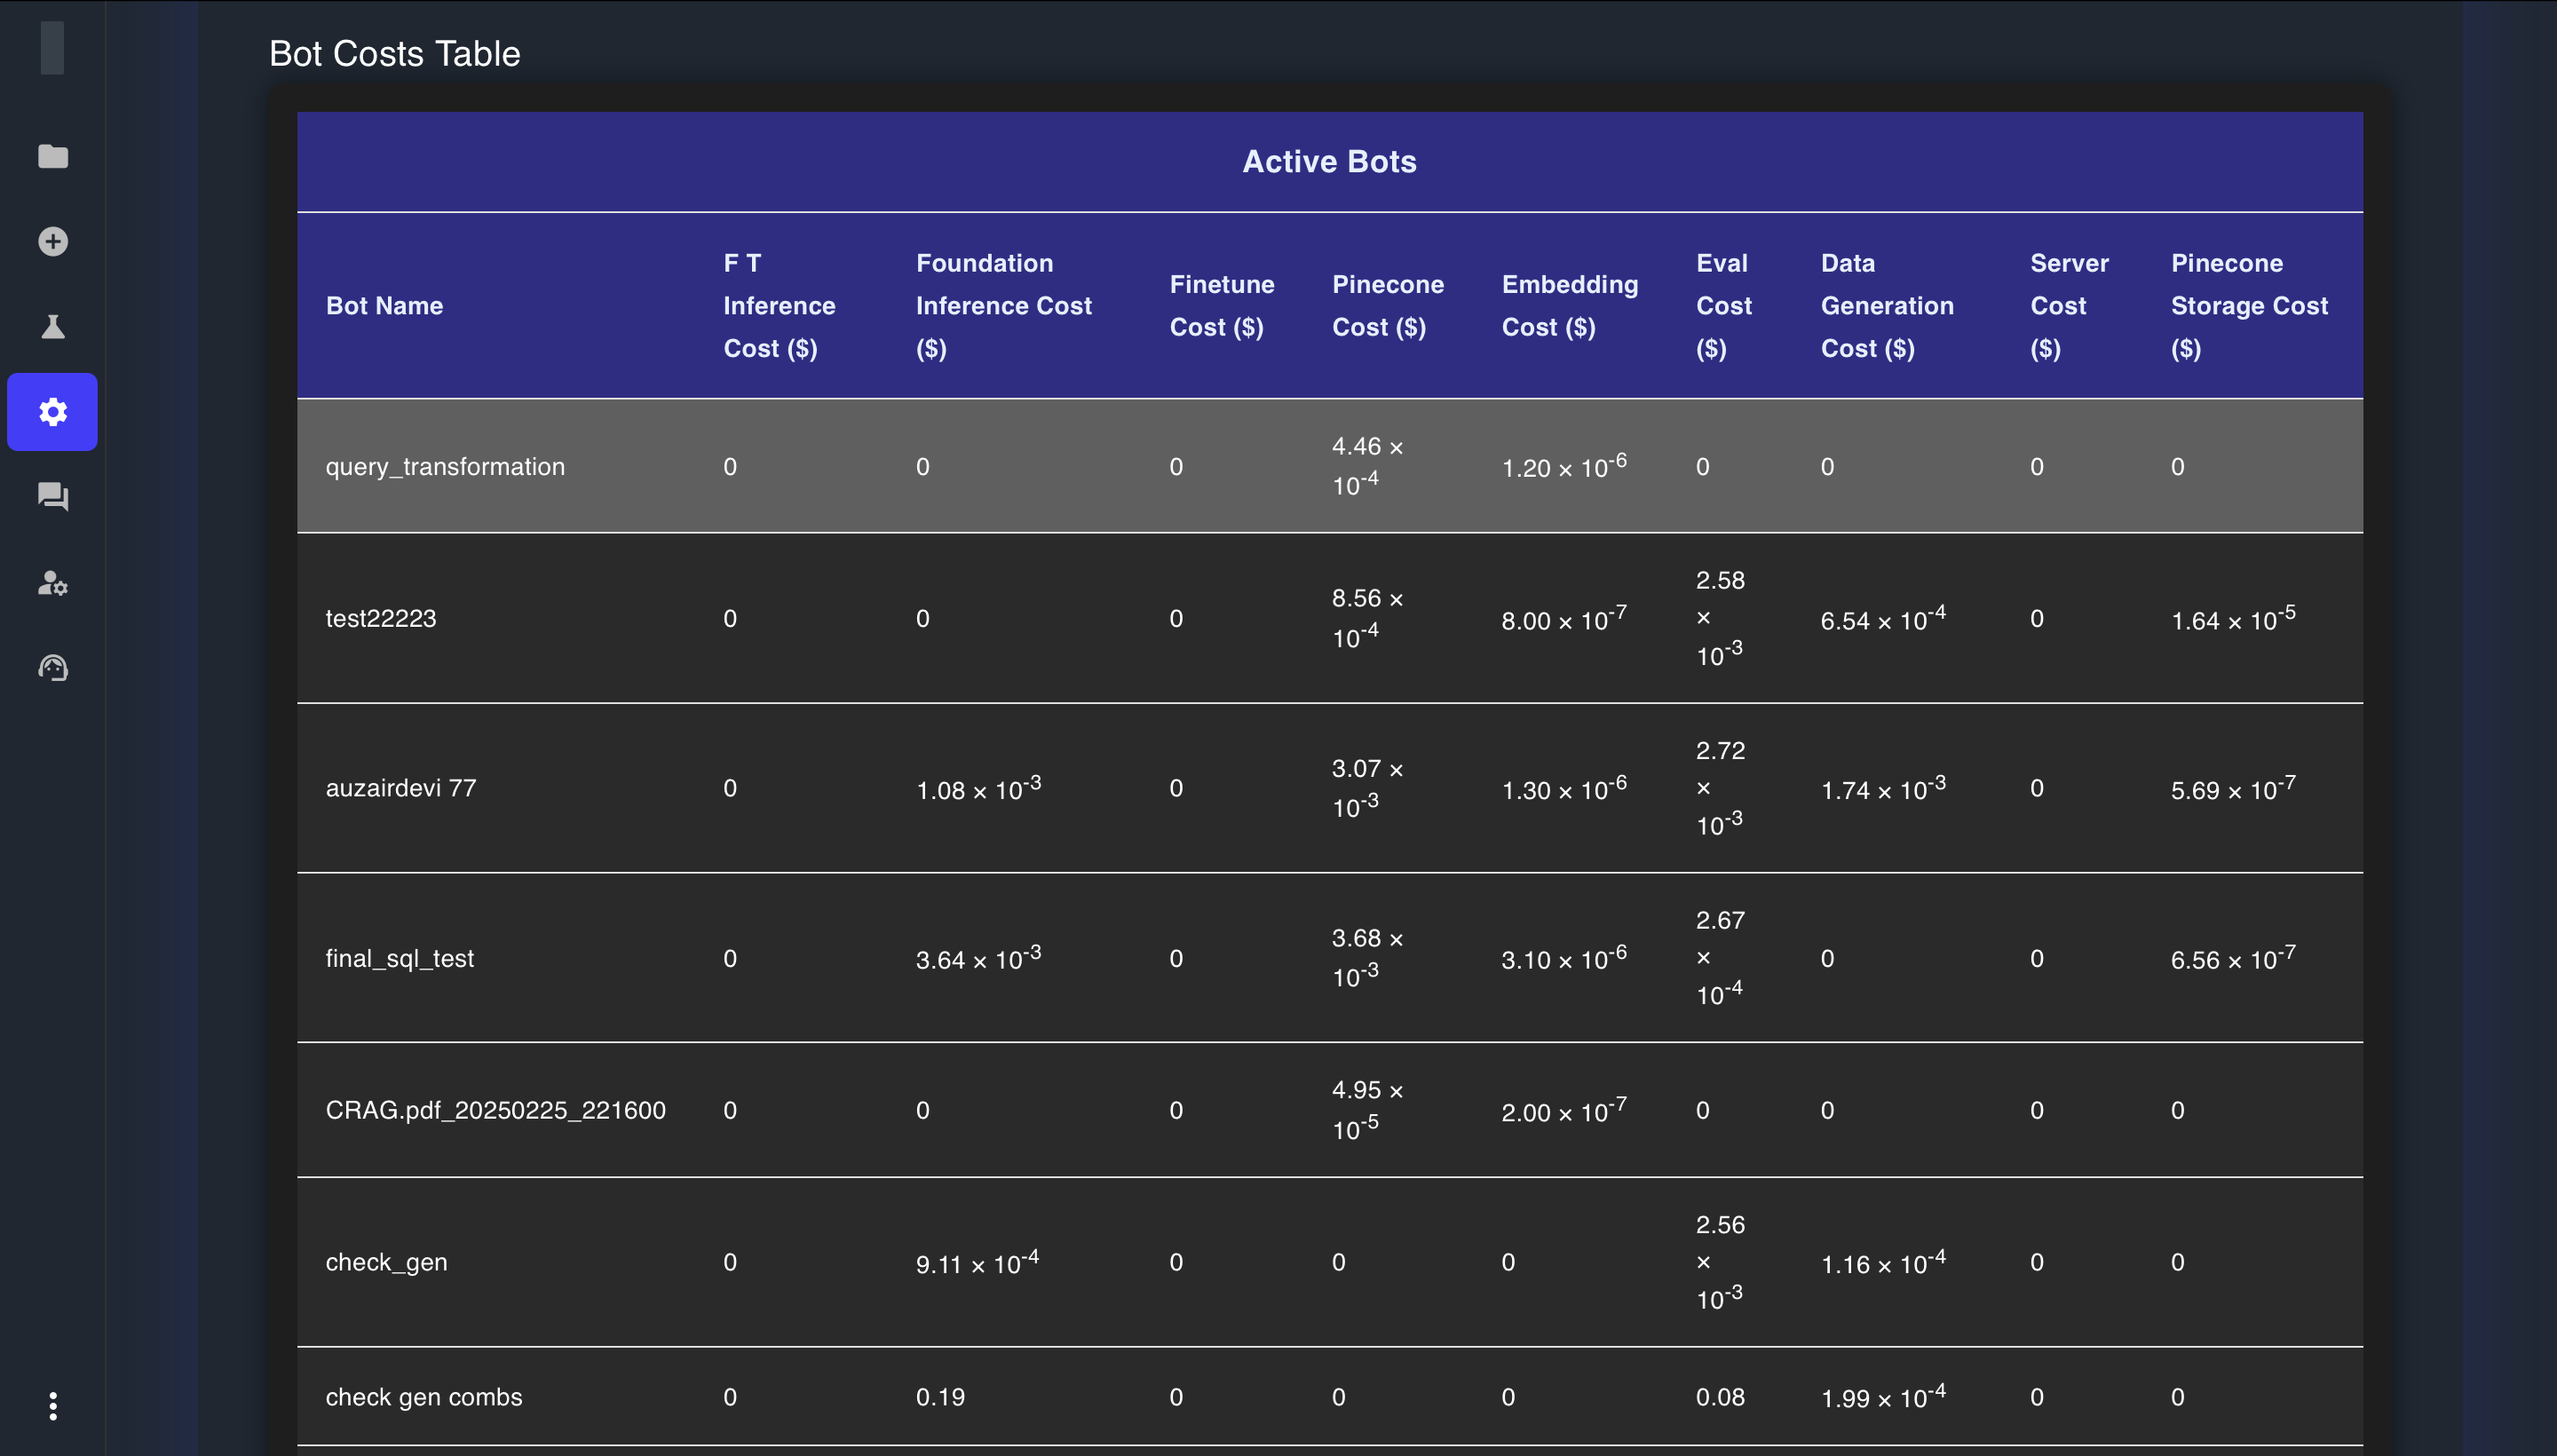
The comprehensive Bot Costs Table provides a tabular view of all your applications and their associated costs across different categories:

This table allows you to:
- Compare costs across multiple applications
- Identify applications with the highest expenses
- Analyze cost distribution across various operations
- Make informed decisions about resource allocation
Visualizing Cost Distribution
Queryloop provides advanced visualization tools to help you understand cost patterns and identify optimization opportunities:
Cost Distribution Heatmap
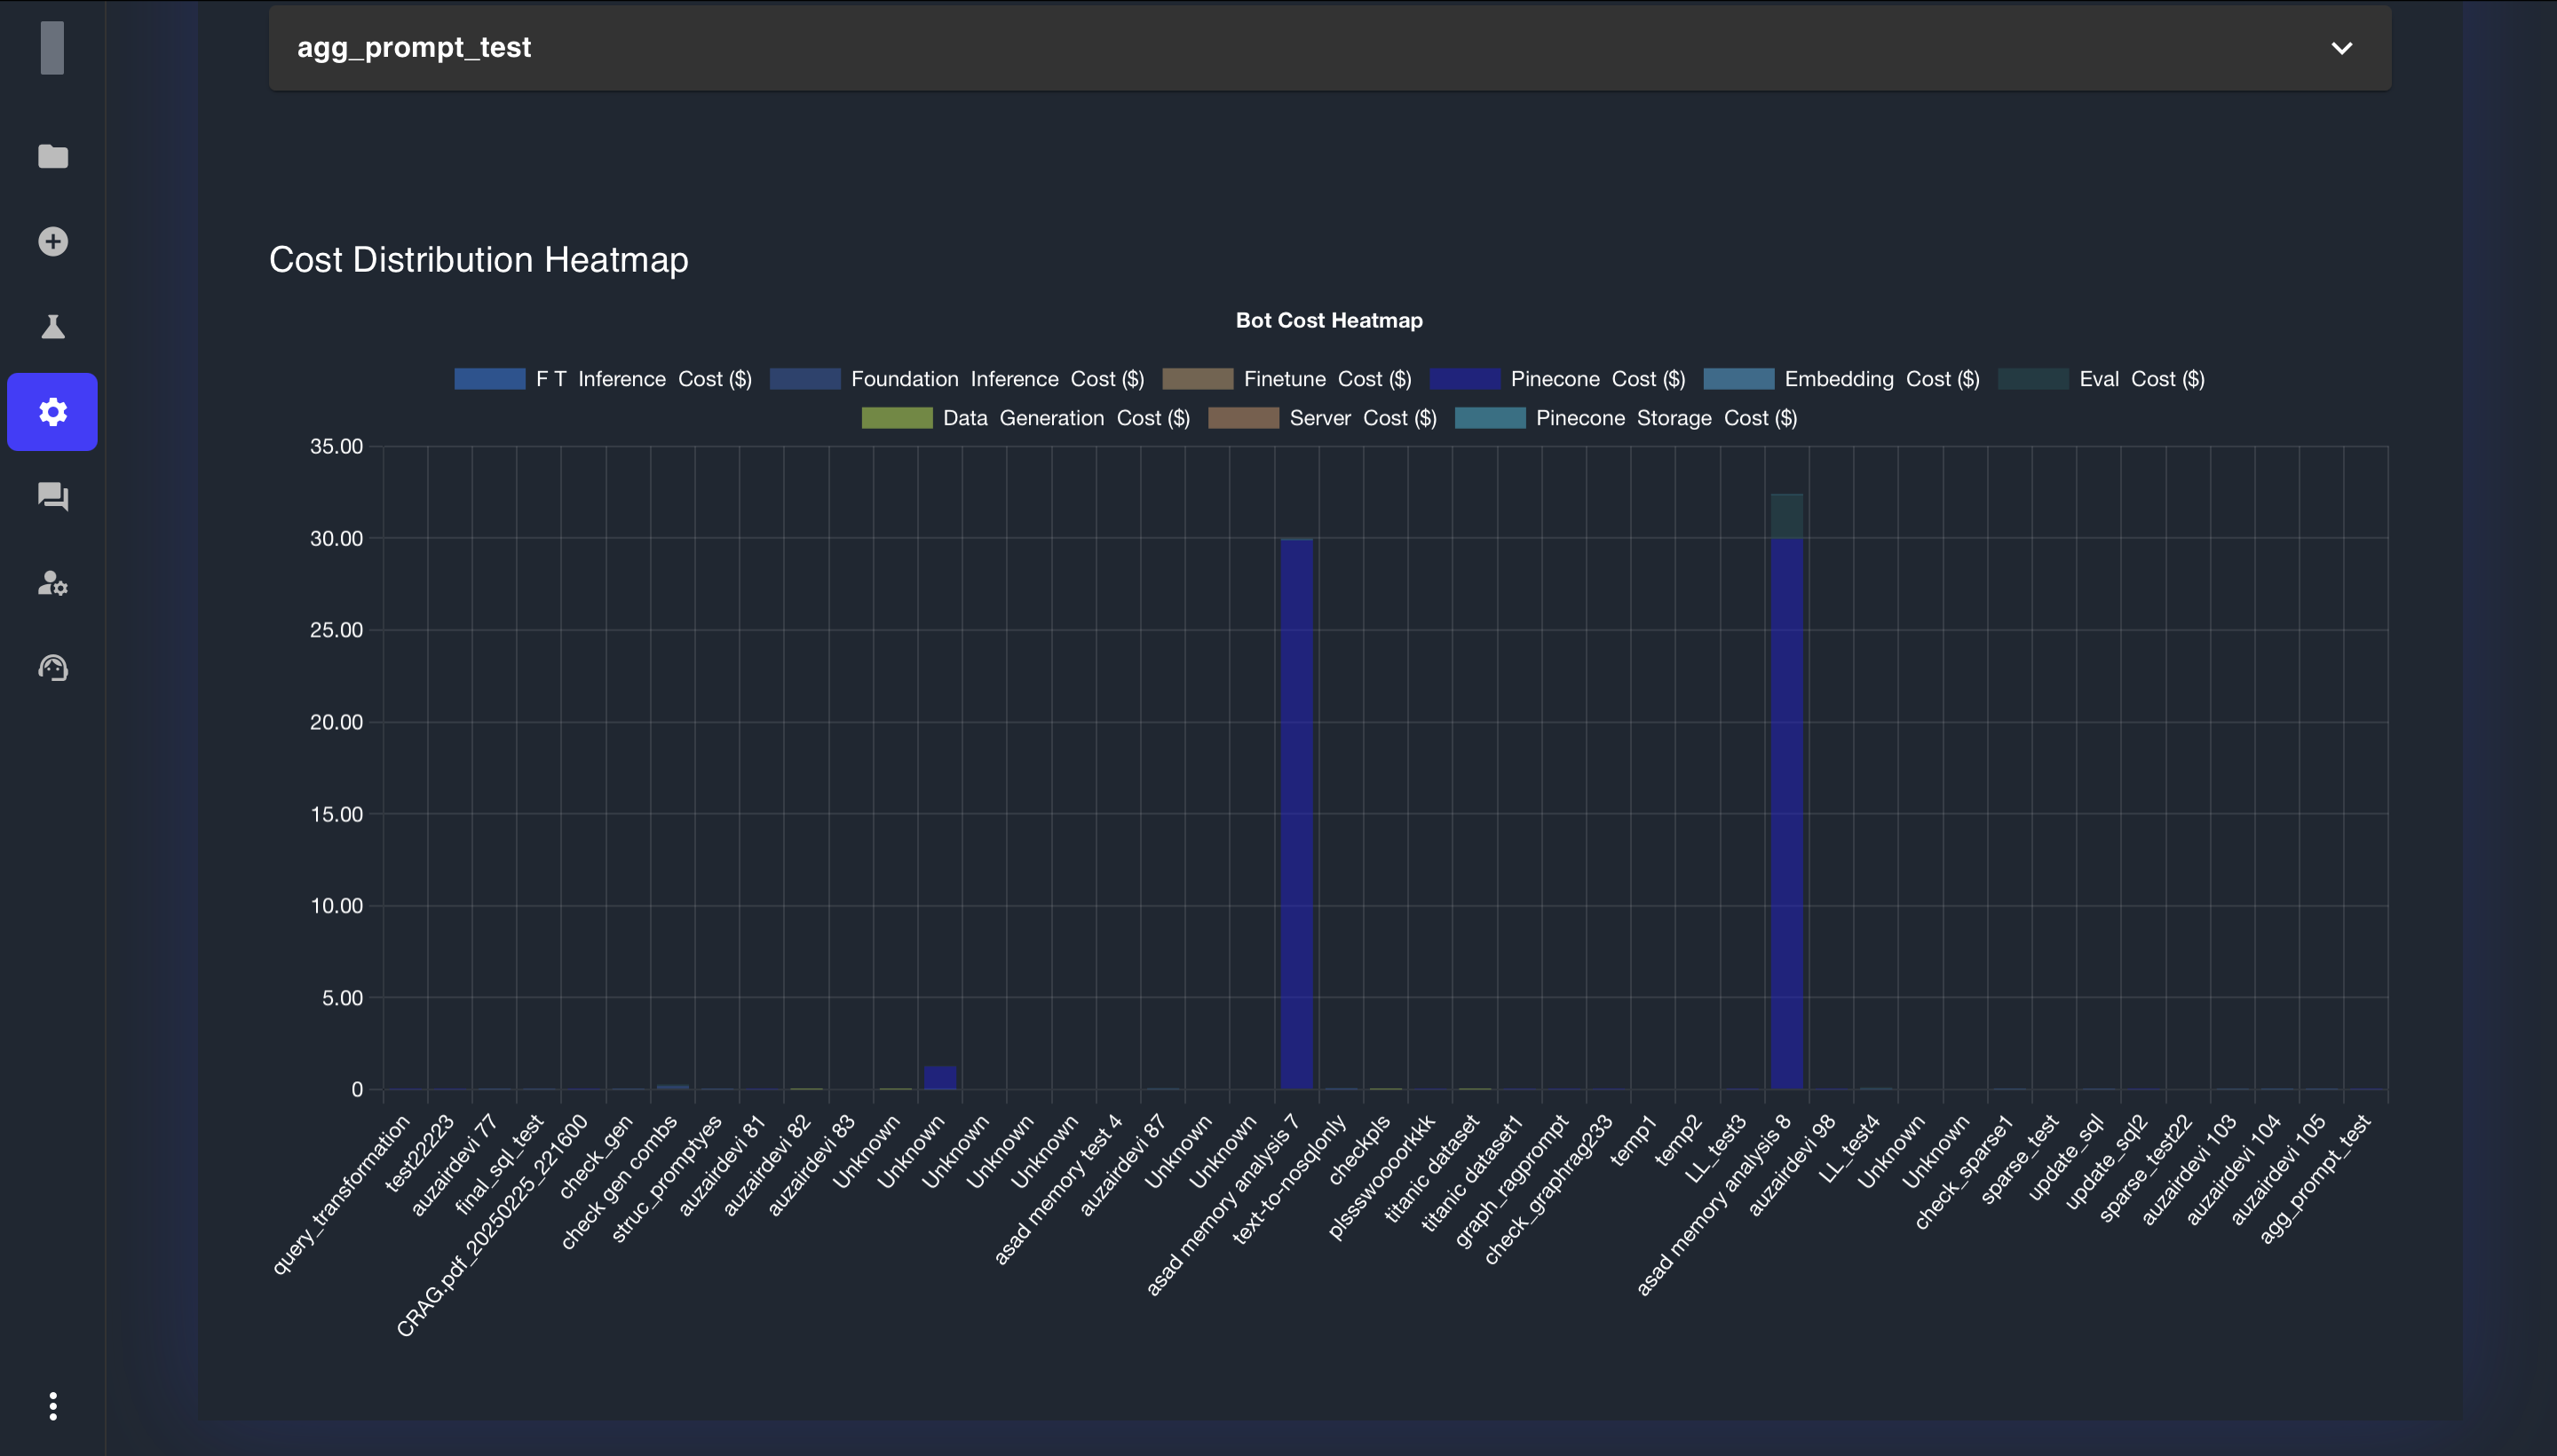
The Cost Distribution Heatmap offers a visual representation of expenses across all your applications and cost categories:

This visualization helps you:
- Quickly identify high-cost applications through color intensity
- Compare relative costs across different applications
- Spot trends in resource consumption
- Focus optimization efforts on the most expensive operations
Detailed Cost Graphs
For each application, you can view detailed cost graphs showing the breakdown of expenses by category:

Hovering over graph elements displays specific cost values, providing precise information about each expense category.
Analyzing Historical Cost Data
To track cost trends over time and plan future budgets, you can review historical usage data:
Month Selection
Use the month selector at the top of the dashboard to navigate between different billing periods:
This feature allows you to:
- Compare costs between different months
- Identify seasonal patterns in usage
- Track the impact of optimization efforts over time
- Plan budgets based on historical consumption patterns
Best Practices for Cost Management
To optimize your Queryloop expenses and ensure efficient resource utilization:
- Regular Monitoring: Review your Usage dashboard weekly to identify unexpected cost increases
- Application Lifecycle Management: Archive or delete unused applications to eliminate ongoing storage costs
- Resource Optimization: Adjust retrieval parameters like chunk size and top-k to reduce vector database operations
- Model Selection: Choose smaller, more efficient models for applications with lower complexity requirements
By leveraging the comprehensive cost and usage analytics tools in Queryloop, you can maintain visibility over your expenses, identify optimization opportunities, and ensure your AI applications are both effective and cost-efficient.